Note
Go to the end to download the full example code
Make a Rectangular AWG
This simple example illustrates how to make a rectangular AWG and how to run a Caphe simulation on it. For this example, we use the Luceda AWG Designer module.
Getting started
We start by importing the technology with other required modules:
from si_fab import all as pdk  # noqa
from ipkiss3 import all as i3
import numpy
import pylab as plt

import awg_designer.all as awg
from si_fab_awg import all as awg_pdk
Next, create a template for the free propagation region. This defines the layers, slab modes, etc.
The aperture
Make a virtual aperture
ap = awg_pdk.SiRibAperture(
    slab_template=slab_t,
    aperture_core_width=W,
    aperture_cladding_width=1.0,
)
ap_lo = ap.Layout()
ap_sm = ap.FieldModelFromCamfr()
ap_cm = ap.CircuitModel(simulation_wavelengths=[1.55])
The input star coupler
Make a multi-aperture for the arms consisting of N apertures like these, arranged in a circle and get the transformations of the individual apertures.
angle_step = i3.RAD2DEG * (W + 0.2) / R
angles_arms = numpy.linspace(-angle_step * (N - 1) / 2.0, angle_step * (N - 1) / 2.0, N)
ap_arms_in, _, trans_arms_in, trans_ports_in = awg.get_star_coupler_apertures(
    apertures_arms=[ap] * N,
    apertures_ports=[ap],
    angles_arms=angles_arms,
    angles_ports=[0],
    radius=R,
    mounting="confocal",
    input=True,
)
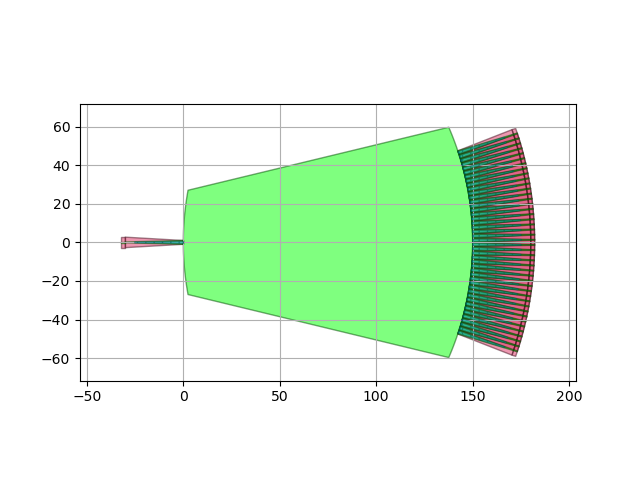
Make the input star coupler
sc_in = awg.StarCoupler(aperture_in=ap, aperture_out=ap_arms_in)

sc_in_lo = sc_in.Layout(
    contour=awg.get_star_coupler_extended_contour(
        apertures_in=[ap],
        apertures_out=[ap] * N,
        trans_in=trans_ports_in,
        trans_out=trans_arms_in,
        radius_in=R,
        radius_out=R,
        extension_angles=(10, 5),
    )
)
sc_in_lo.visualize()
<Figure size 640x480 with 1 Axes>
The output star coupler
Make the multi-apertures for the outputs and get the transformations for the individual apertures.
angle_step = i3.RAD2DEG * (4.7) / R
angles_ports = numpy.linspace(angle_step * (M - 1) / 2.0, -angle_step * (M - 1) / 2.0, M)
ap_arms_out, ap_out, trans_arms_out, trans_ports_out = awg.get_star_coupler_apertures(
    apertures_arms=[ap] * N,
    apertures_ports=[ap] * M,
    angles_arms=angles_arms,
    angles_ports=angles_ports,
    radius=R,
    mounting="rowland",
    input=False,
)
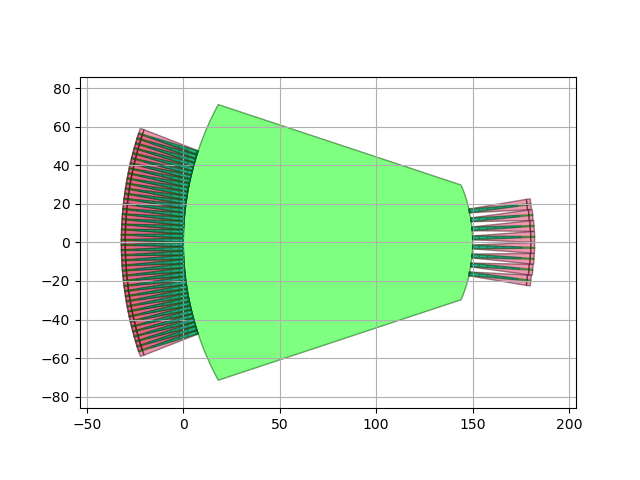
Make the output star coupler
sc_out = awg.StarCoupler(aperture_in=ap_arms_out, aperture_out=ap_out)
sc_out_lo = sc_out.Layout(
    contour=awg.get_star_coupler_extended_contour(
        apertures_in=[ap] * N,
        apertures_out=[ap] * M,
        trans_in=trans_arms_out,
        trans_out=trans_ports_out,
        radius_in=R,
        radius_out=R / 2,
        extension_angles=(10, 10),
    )
)
sc_out_lo.visualize()
<Figure size 640x480 with 1 Axes>
The rectangular waveguide array
Make the RectangularWaveguideArray
<RectangularWaveguideArray.Layout view 'RectangularWaveguideArray_1:layout'>
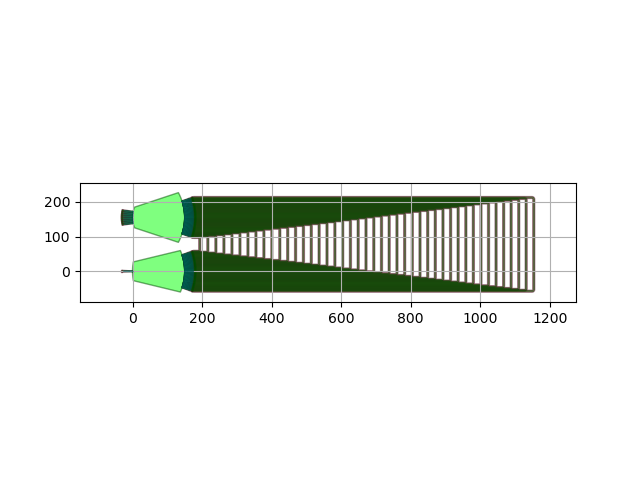
The Arrayed Waveguide Grating
Make an AWG with the 3 building blocks
rect_awg = awg.ArrayedWaveguideGrating(
    star_coupler_in=sc_in,
    star_coupler_out=sc_out,
    waveguide_array=waveguide_array,
)

awg_lo = rect_awg.Layout()
awg_lo.visualize()
<Figure size 640x480 with 1 Axes>
Running the Caphe simulation
print("Running Caphe simulation (with wavelength-independent star couplers)")
sc_in.CircuitModel(simulation_wavelengths=[1.55])
sc_out.CircuitModel(simulation_wavelengths=[1.55])
awg_cm = rect_awg.CircuitModel()
wavelengths = numpy.linspace(1.52, 1.58, 401)

import time  # noqa

t0 = time.time()
S = awg_cm.get_smatrix(wavelengths)
print("Calculation time:", time.time() - t0)

for i in range(1, M + 1):
    plt.plot(wavelengths, 10 * numpy.log10(numpy.abs(S["in1", "out{}".format(i)]) ** 2), label="out{}".format(i))
plt.xlabel("Wavelength")
plt.ylabel("Transmission [dB]")
plt.legend()
plt.show()
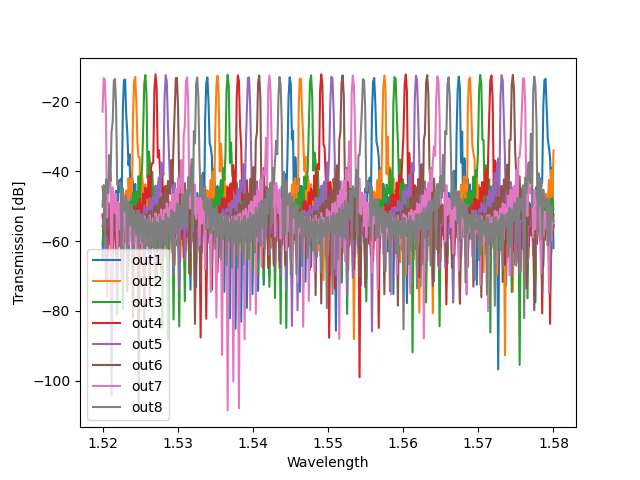
Running Caphe simulation (with wavelength-independent star couplers)
Calculation time: 35.93276405334473
Using SpectrumAnalyzer to analyze the results
We finally use i3.SpectrumAnalyzer to
detect the peaks and calculate the crosstalk.
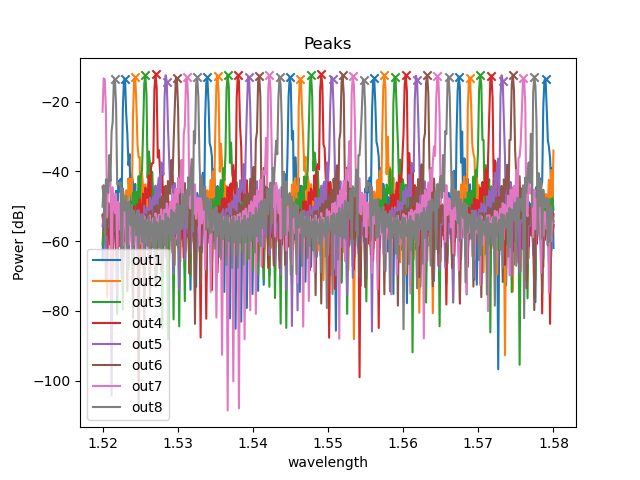
<Figure size 640x480 with 1 Axes>
Let’s calculate the passbands for a cutoff of 25 dB:
bands = sa.cutoff_passbands(-25)
And then calculate the nearest neighbor crosstalk for each channel. The value reported for out1 is the crosstalk caused by the neirest channels out8 and out2:
print(sa.near_crosstalk(bands))
OrderedDict([('out1', -31.23647722883311), ('out2', -28.541374107201744), ('out3', -28.884413846502937), ('out4', -29.58195008288397), ('out5', -29.07117242399547), ('out6', -28.66161626012397), ('out7', -28.43442558539506), ('out8', -31.46519699601128)])
We also calculate the far neighbor crosstalk, which ignores nearest neighbors:
print(sa.far_crosstalk(bands))
OrderedDict([('out1', -34.567785629502325), ('out2', -34.66204499680224), ('out3', -35.45329942179763), ('out4', -36.85881897261186), ('out5', -35.37251774449037), ('out6', -35.21353059231565), ('out7', -34.47836914658952), ('out8', -34.59466387775356)])