Heaters
SiFab contains one heater:
HeatedWaveguide: a waveguide with a heater layer on each side. The section Model and simulation recipes explains the model used to simulate this heater.
HeatedWaveguide
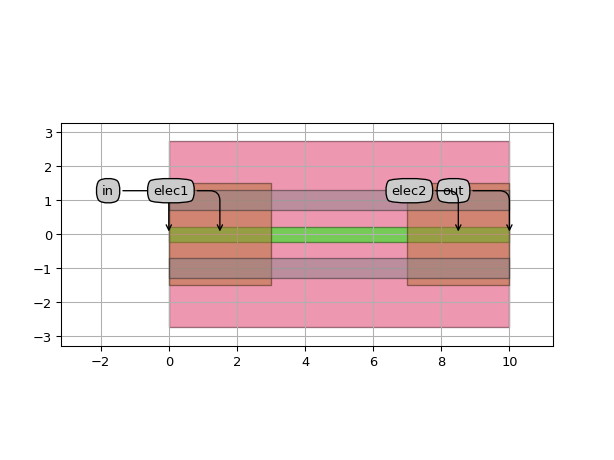
This component consists of a waveguide with a heater layer on each side, drawn on the HT layer. It is used to change the phase of the light travelling through the waveguide by exploiting the thermo-optic effect in silicon. At the beginning and at the end of the waveguide, metal vias are used to connect the heater metal to a metal contact pad on the M1 layer.
The following parameters can be changed:
heater_width: Width of the heater layer.heater_offset: Offset of the heaters from the center.m1_extension: Extension of the M1 contact beyond the heaters. The total width of M1 is equal to \(2 \times m1\_extension + heater\_width + 2 \times heater\_offset\).m1_length: Length of the M1 contact areas.
Reference
Click on the name of the component below to see the complete PCell reference.
Phase shifter waveguide with heater layers on each side. |
Example
import si_fab.all as pdk
from ipkiss3 import all as i3
# Heater with straight shape
ht = pdk.HeatedWaveguide(
heater_width=0.6,
heater_offset=1.0,
m1_extension=0.2,
m1_length=3.0,
)
ht_lv = ht.Layout(shape=[(0.0, 0.0), (10.0, 0.0)])
ht_lv.visualize(annotate=True)
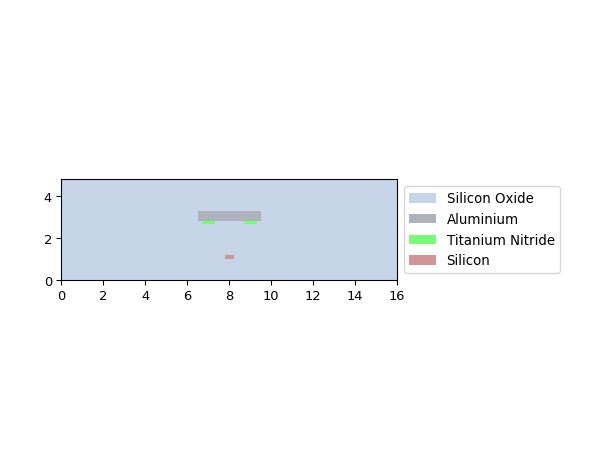
xs = ht_lv.cross_section(cross_section_path=i3.Shape([(1.0, -8.0), (1.0, 8.0)]))
xs.visualize()
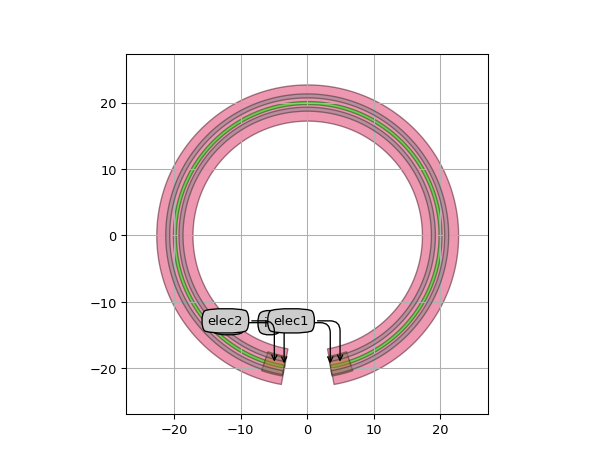
# Heater with rounded shape
ht = pdk.HeatedWaveguide()
ht_shape = i3.ShapeArc(radius=20.0, start_angle=280, end_angle=260)
ht_lv = ht.Layout(shape=ht_shape)
ht_lv.visualize(annotate=True)
Model and simulation recipes
The phase of the waveguide is calculated using the effective index (\(n_{eff}\)) of the trace template (trace_template) used to draw the waveguide.
The model of the heater adds a phase modulation to the phase of the waveguide that is calculated as follows:
where
\(L\) and \(W\) are the length and width of the heater, respectively;
\(V_d\) is the voltage drop over the phase shifter length;
\(P_{\pi\square}\) is the power required on a square of heater material with a unit sheet resistance (1 \(\Omega / \square\)) to achieve a \(\pi\) phase shift.
Usign the power dissipated over the heater to achieve a \(\pi\) phase shift can be calculated as:
where \(R_{sh}\) is the sheet resistance of the heater metal.
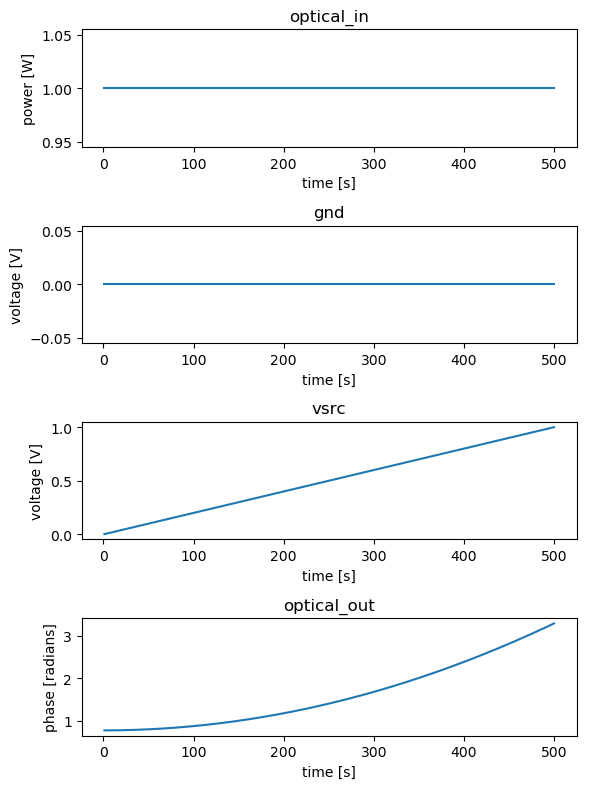
Using the simulation recipe simulate_heater one can easily check the phase shift caused by a voltage sweep from \(0\) to \(1\), as well as the associated current density.
The sheet resistance \(R_{sh} = 0.5\) \(\Omega / \square\) is stored in the SiFab PDK and can be considered fixed.
Reference
Click on the name of the function below to see the complete API reference of the simulation recipe.
|
Simulation recipe to simulate a heater by sweeping the bias voltage. |
Example
import si_fab.all as pdk
from si_fab.components.heater.simulation.simulate import simulate_heater
from si_fab.components.heater.pcell.cell import r_sheet
import pylab as plt
import numpy as np
import os

# Heated waveguide
name = "heater_sweep"
length = 100
ht = pdk.HeatedWaveguide(
    heater_width=0.6,
    heater_offset=1.0,
    m1_extension=0.2,
    m1_length=3.0,
)
ht_lv = ht.Layout(shape=[(0.0, 0.0), (length, 0.0)])

# Power for pi phase shift per square of unit sheet resistance
p_pi = 30e-3  # W
p_pi_sq = r_sheet * p_pi
ht.CircuitModel(p_pi_sq=p_pi_sq)

results = simulate_heater(
    cell=ht,
    v_start=0,
    v_end=1,
    nsteps=500,
    center_wavelength=1.5,
    debug=False,
)
times = results.timesteps


def phase_unwrap_normalize(transmission):
    unwrapped = np.unwrap(np.angle(transmission))
    return unwrapped - unwrapped[0]


signals = ["optical_in", "gnd", "vsrc", "optical_out"]
process = [np.real, np.real, np.real, phase_unwrap_normalize]
ylabels = ["power [W]", "voltage [V]", "voltage [V]", "phase [radians]"]

fig, axs = plt.subplots(nrows=len(signals), ncols=1, figsize=(6, 8))
for axes, process, signal, ylabel in zip(axs, process, signals, ylabels):
    data = process(results[signal])
    axes.set_title(signal)
    axes.plot(times[1:], data[1:])
    axes.set_ylabel(ylabel)
    axes.set_xlabel("time [s]")
plt.tight_layout()
fig.savefig(os.path.join("{}.png".format(name)), bbox_inches="tight")
plt.show()