import_touchstone_smatrix
- ipkiss3.io.touchstone.import_touchstone_smatrix(filename, term_mode_map=None, unit=None)
Imports an S matrix frequency sweep from a touchstone file.
More information on the touchstone file format can be found in
this document.- Parameters:
- filename: str
filename to import
- term_mode_map: dict
Maps (term, modenr) to TouchStone port_mode numbers. Use None for first attempting to derive from tool-specific parsing of the file header and when that fails assign default port names
- unit: str
When specified, the sweep values will be converted to this unit. e.g. when the unit is ‘um’ the sweep_parameter_values will be in micrometer instead of the unit used in the touchstone file.
- Returns:
- smatrix: SMatrix1DSweep
1D S matrix sweep
Examples
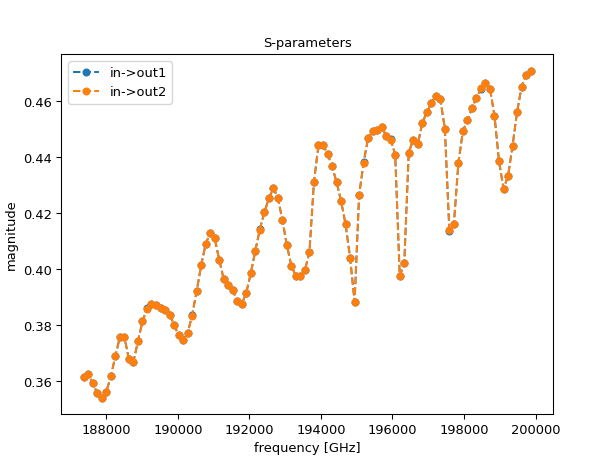
In this example we import a Touchstone file named ‘smatrix_fdtd.s6p’, made using the Link for Ansys Lumerical. You can download the
Touchstone fileand try the example below yourself. It represents a component with one input port and two output ports, where each port has 2 modes assigned to it. This configuration produces the number 6 (= 3 ports x 2 modes) in the extension. Also note how the file has a header containing metadata about the ports:! Touchstone file export Luceda Link for Ansys Lumerical ! Luceda port in:mode 0:0 ! Luceda port in:mode 1:1 ! Luceda port out2:mode 0:2 ! Luceda port out2:mode 1:3 ! Luceda port out1:mode 0:4 ! Luceda port out1:mode 1:5
This metadata is used by our importer if
term_mode_mapis set toNone. It represents a mapping between ports in IPKISS/Lumerical and the Touchstone port numbers. For example, the second line maps the IPKISS portin:0(= port in:mode 1) to Touchstone port0.import ipkiss3.all as i3 from ipkiss3.io.touchstone import import_touchstone_smatrix import matplotlib.pyplot as plt import numpy as np S = import_touchstone_smatrix('smatrix_fdtd.s6p') plt.figure() plt.plot(S.sweep_parameter_values, np.abs(S["out1", "in"])**2, 'o--', label='in->out1', markersize=5) plt.plot(S.sweep_parameter_values, np.abs(S["out2", "in"])**2, 'o--', label='in->out2', markersize=5) plt.xlabel('frequency [GHz]') plt.ylabel('magnitude') plt.title('S-parameters') plt.legend() plt.show()
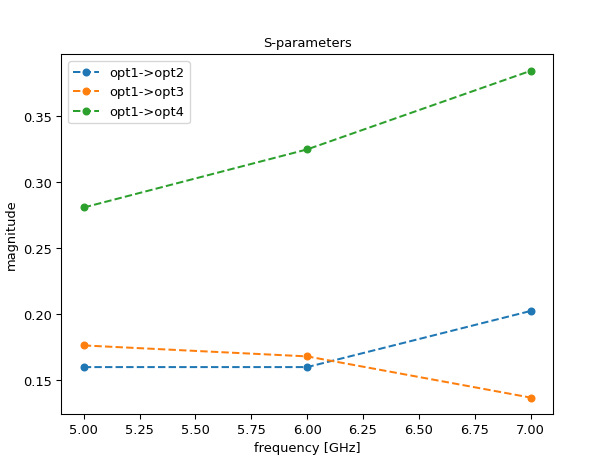
The next example shows how to set your own term_mode_map:
import ipkiss3.all as i3
from ipkiss3.io.touchstone import import_touchstone_smatrix
import matplotlib.pyplot as plt
import numpy as np
touchstone_4port = '''! 4-port S-parameter data, taken at three frequency points
# GHZ S MA R 50
5.00000 0.60 161.24 0.40 -42.20 0.42 -66.58 0.53 -79.34 !row 1
        0.40 -42.20 0.60 161.20 0.53 -79.34 0.42 -66.58 !row 2
        0.42 -66.58 0.53 -79.34 0.60 161.24 0.40 -42.20 !row 3
        0.53 -79.34 0.42 -66.58 0.40 -42.20 0.60 161.24 !row 4
6.00000 0.57 150.37 0.40 -44.34 0.41 -81.24 0.57 -95.77 !row 1
        0.40 -44.34 0.57 150.37 0.57 -95.77 0.41 -81.24 !row 2
        0.41 -81.24 0.57 -95.77 0.57 150.37 0.40 -44.34 !row 3
        0.57 -95.77 0.41 -81.24 0.40 -44.34 0.57 150.37 !row 4
7.00000 0.50 136.69 0.45 -46.41 0.37 -99.09 0.62 -114.19 !row 1
        0.45 -46.41 0.50 136.69 0.62 -114.19 0.37 -99.09 !row 2
        0.37 -99.09 0.62 -114.19 0.50 136.69 0.45 -46.41 !row 3
        0.62 -114.19 0.37 -99.09 0.45 -46.41 0.50 136.69 !row 4
'''
filename = "touchstone_4port_example.s4p"

with open(filename, 'w') as f:
    f.write(touchstone_4port)

term_mode_map = {
    ("opt1", 0): 0,
    ("opt2", 0): 1,
    ("opt3", 0): 2,
    ("opt4", 0): 3
}

S = import_touchstone_smatrix(filename, term_mode_map=term_mode_map)

plt.figure()
plt.plot(S.sweep_parameter_values, np.abs(S["opt2", "opt1"])**2, 'o--', label='opt1->opt2', markersize=5)
plt.plot(S.sweep_parameter_values, np.abs(S["opt3", "opt1"])**2, 'o--', label='opt1->opt3', markersize=5)
plt.plot(S.sweep_parameter_values, np.abs(S["opt4", "opt1"])**2, 'o--', label='opt1->opt4', markersize=5)
plt.xlabel('frequency [GHz]')
plt.ylabel('magnitude')
plt.title('S-parameters')
plt.legend()
plt.show()